Indicator Analysis
The "Indicator Analysis" page enables both registered and anonymous users to access default reports aligned with their sectors and locations. Registered users can also create customized reports by selecting indicators , with export options including CSV, XLS, PDF, and images for versatile data utilization.
Accessing the Indicator Analysis
What : Access The Indicator Analysis
Who : All users, including anonymous users, can access the Indicator analysis.
How :
- Go to https://tims.unhcr.org/ in your web browser.
- If you are a registered user, sign in with your username and password as usual. For anonymous users, you can directly access the Indicator Analysis without signing in.
-
Open the Indicator Analysis page
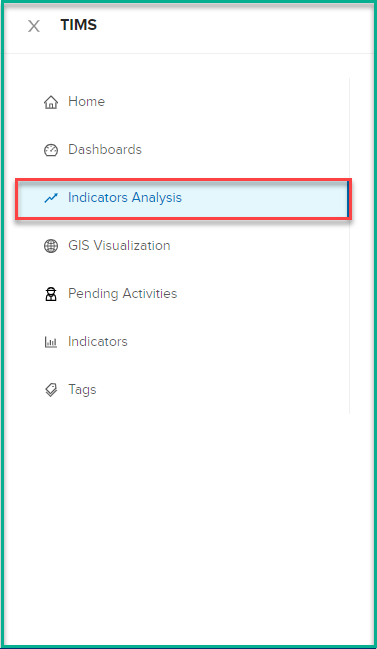
Note that both logged-in users can access the indicator analysis and view the publicly available data. However, non-logged-in users will have access only to public indicator data
Filtering Indicators
What : Customize your Dashboard using the following filters:
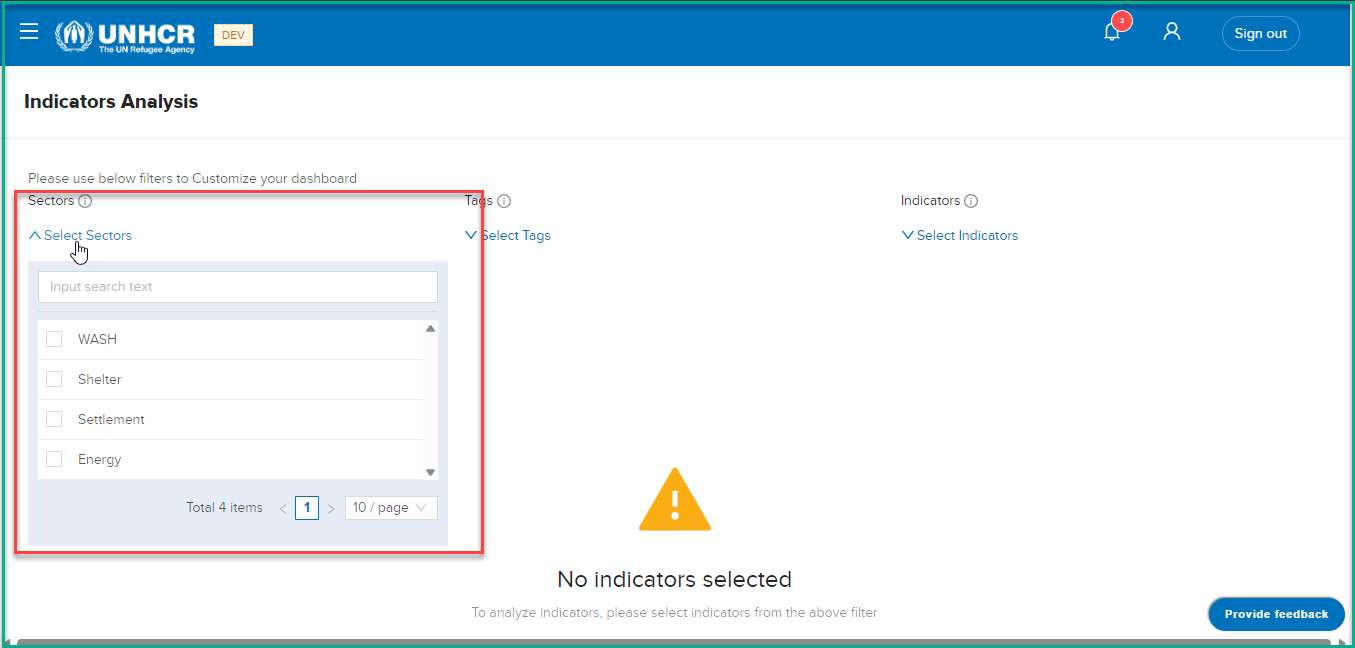
Sectors Filter
What: Select Sectors
Who: All users, including anonymous users, can use this filter to narrow down data based on sectors.
How: Choose specific sectors from the provided options to focus on indicators that align with that sector.
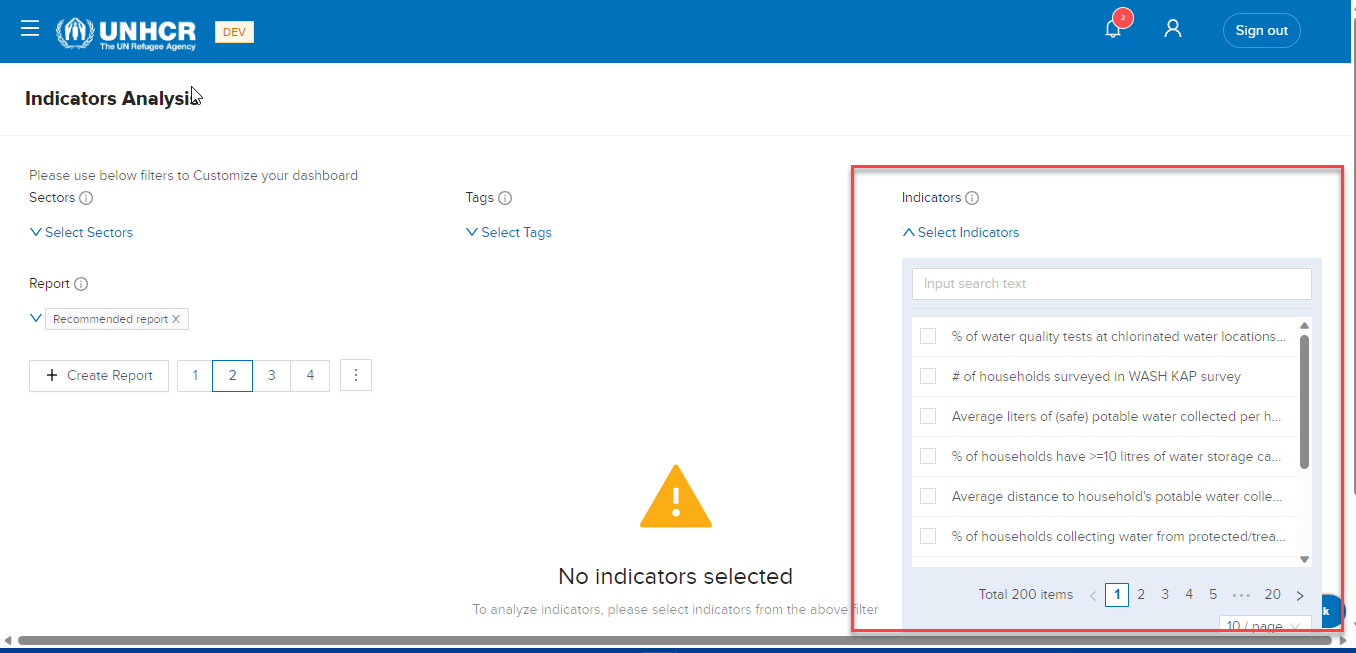
Indicators Filter
What: Select Indicators
Who: All users, including anonymous users, can use this filter to choose indicators for analysis.
How: Choose indicators from indicators list .
View Default Report
On TIMS, we offer a multitude of default reports tailored to cater to both registered and anonymous users. These reports provide comprehensive and insightful analyses of survey data, empowering users with valuable information to make informed decisions.
Register users
- Go to https://tims.unhcr.org/ in your web browser.
- If you are a registered user, sign in with your username and password as usual.
-
Open the Indicator Analysis page
Note The default report will automatically select indicators and locations based on the user's login information. This means that when a user logs in, the report will display relevant data specific to their assigned sector and location. The default selection ensures that users are presented with the most relevant and context-specific information upon accessing the report. Users can further customize the report by making changes to the selected indicators and locations as needed.
Anonymous users
- Go to https://tims.unhcr.org/ in your web browser.
- For anonymous users, you can directly access the Indicator Analysis without signing in.
- Open the Indicator Analysis page
The default report will automatically select indicators and locations based on Public Report Configuration.
Add Report
-
Open the "Indicator Analysis" page.
-
Click on the "Create Report" button.
-
A new dialog titled "Add Report" will appear.
-
In the "Add Report" dialog, you will find the following fields:
Report Name: Enter the name for your report in this field.
Report Description: Provide a brief description of the report in this field.
Visibility: Choose between "Private" and "Public" visibility options.
"Private": The report will only be accessible to the creator (you) .
"Public": The report will be visible to all users .
 Display for non-logged-in users: Choose between "Yes" and "No" options.
 "Yes": If selected, anonymous users will be able to see and access the report.
 "No": If selected, the report will be restricted to registered users only.
After filling in the necessary details and configuring preferences, click the "Create" button to add the new report.
-
Click on the "Report List" to view all the available reports.
-
From the list of reports, select the report you have just created.
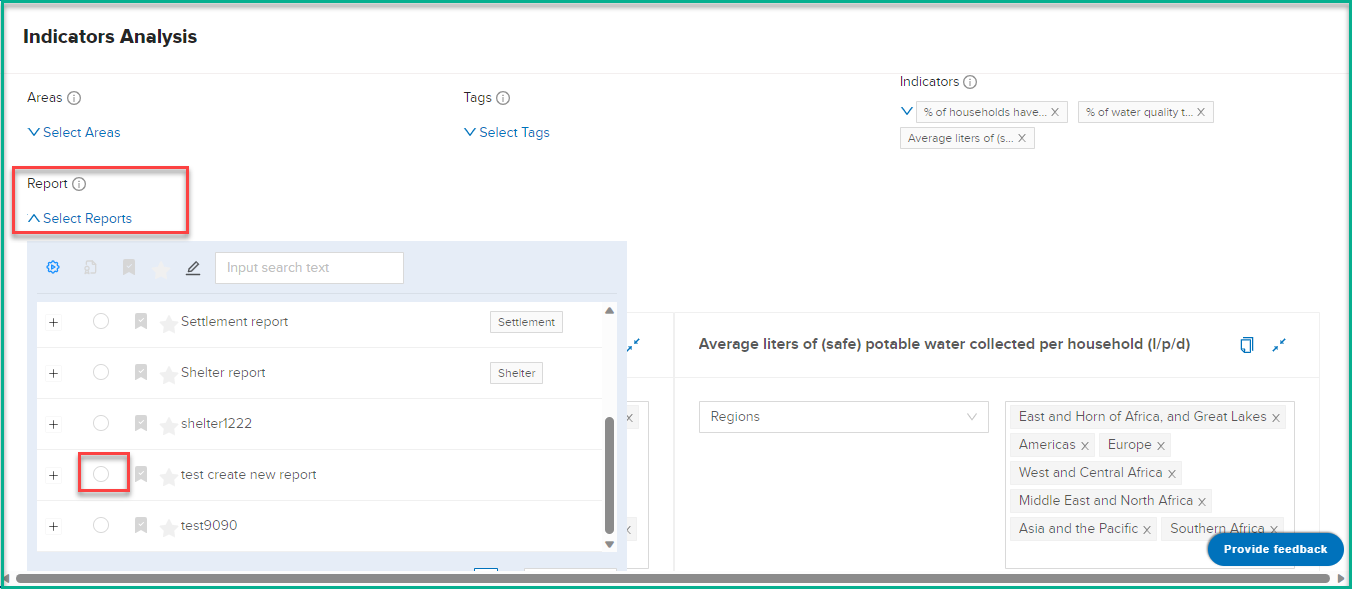
-
Once you have selected your report, you can now start building it by adding indicators and other elements.
-
Go to the "Indicators List" to see the available indicators.
-
Select the indicators you want to include in your report by clicking on them.
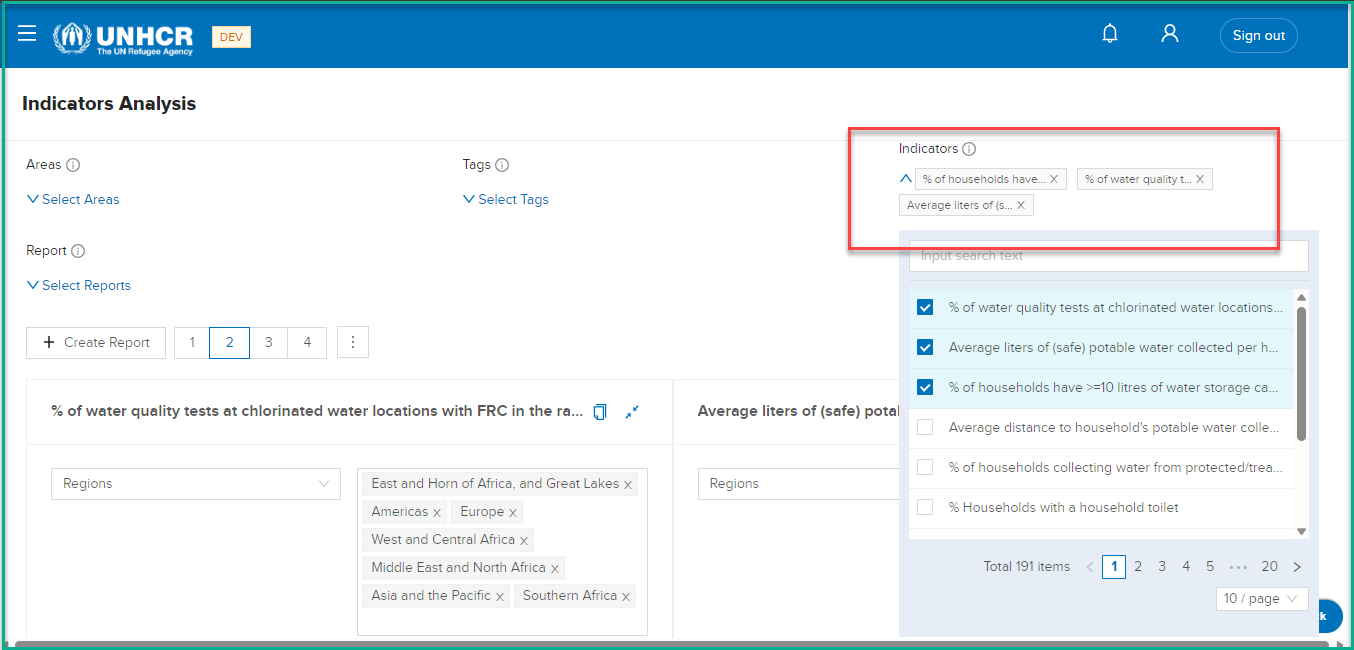
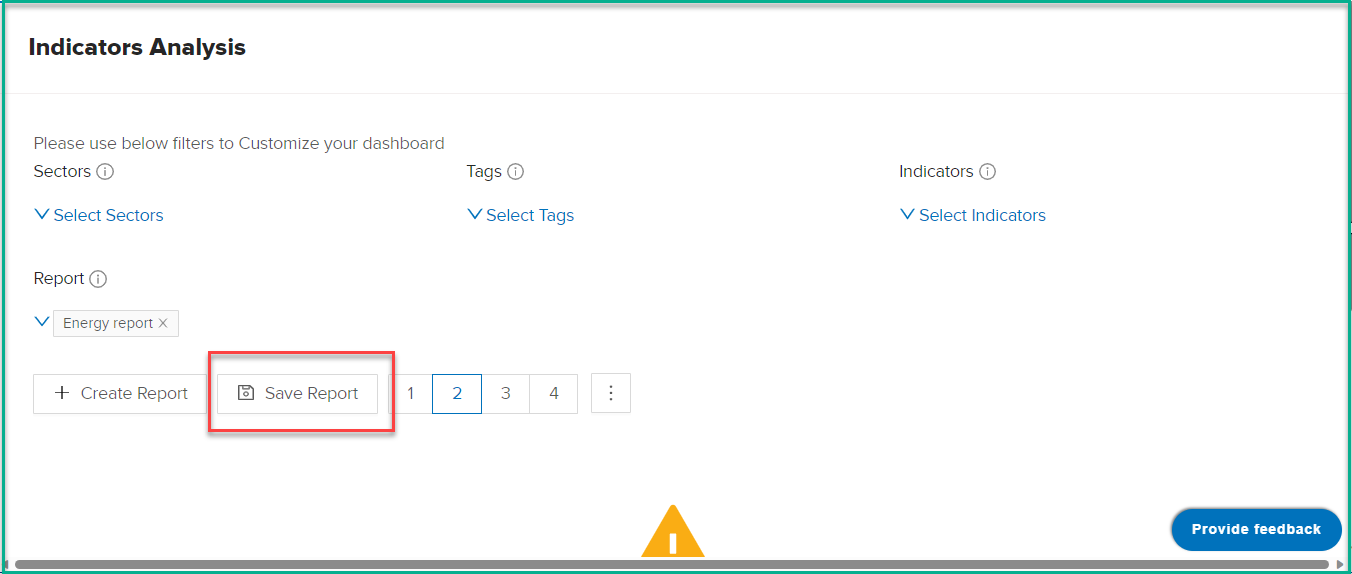
- After selecting the desired indicators, click on the "Save" button to add them to your report.
Edit Report
-
Click on the "Report List" to view all the available reports.
-
From the list of reports, select the report you want to update.
-
Once you have selected your report, you can now start updating it by adding indicators and other elements.
-
Go to the "Indicators List" to see the available indicators.
-
Select the indicators you want to include in your report by clicking on them.
- After selecting the desired indicators, click on the "Save" button to add them to your report.
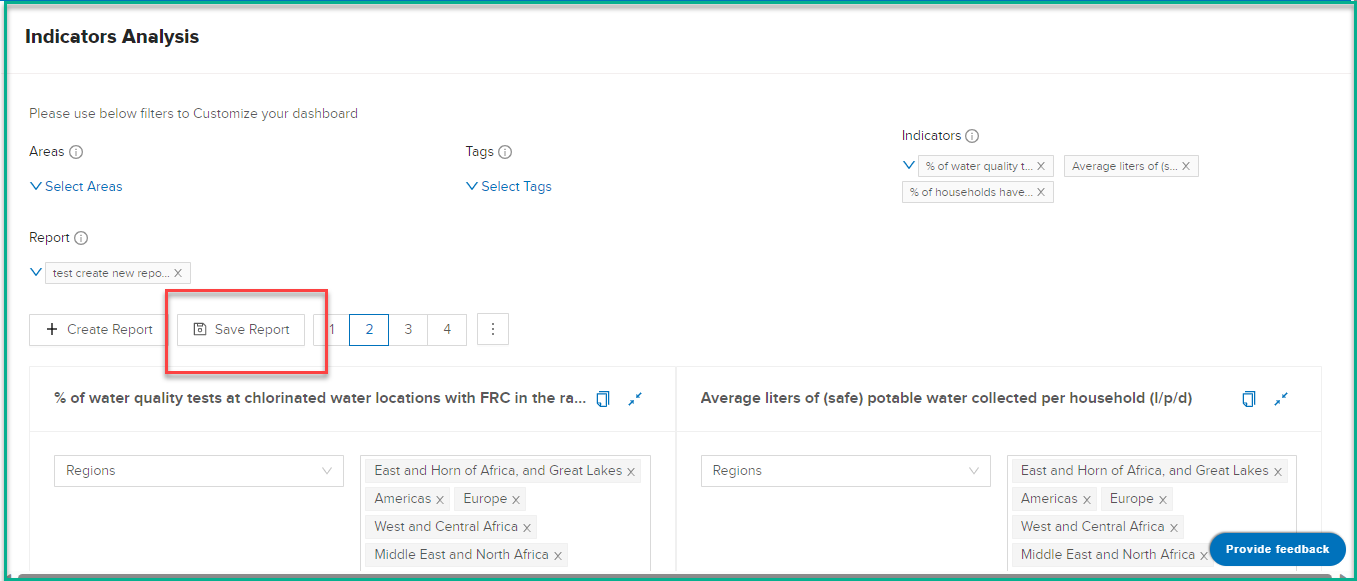
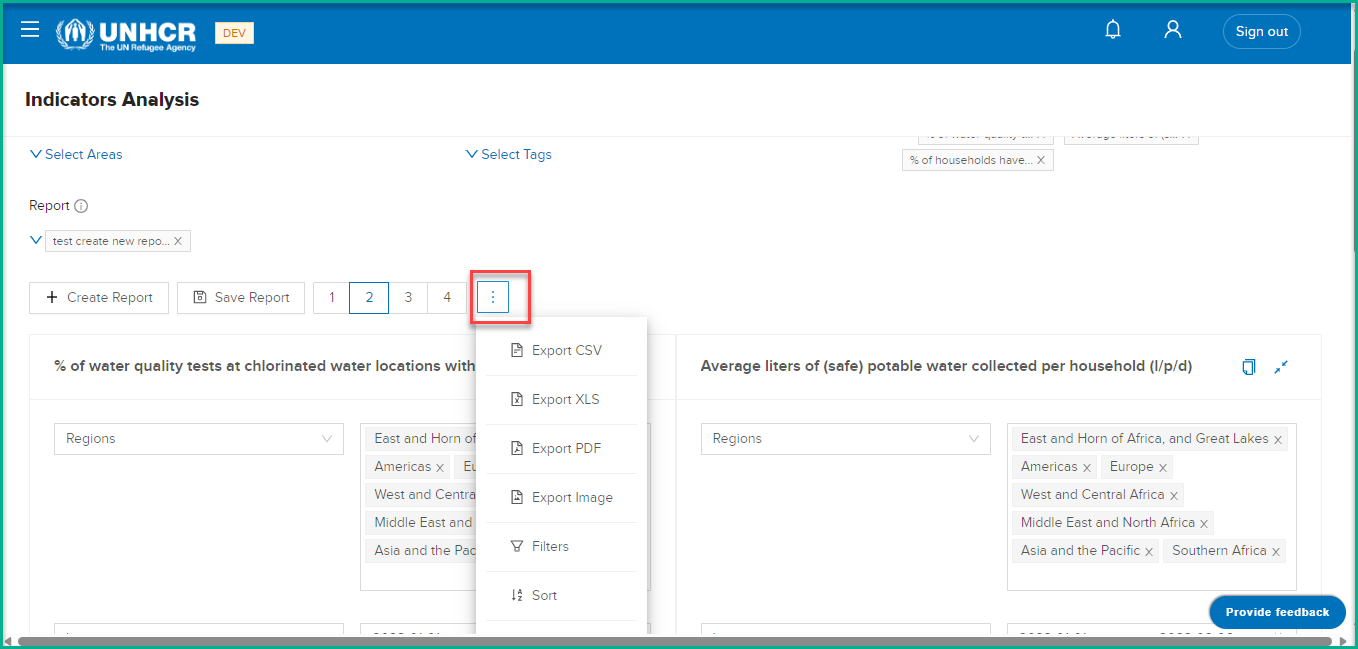
Export Report Data
To export the report, follow these steps:
- Click on the ":" icon located on the report interface.
-
The system will display a list of export options, including:
Export as CSV Export as XLS (Excel format) Export as PDF Export as Image -
Choose the desired export option based on your preference.
-
The system will generate the export file and prompt you to save it to your device.
-
Once saved, you can access the exported file and use it as needed.
Bookmark Custom Reports
The Bookmark Custom Reports feature enhances user experience by allowing the saving of indicator and filter selections for future use. Users can select desired indicators, apply filters, and save the report as public or private. By bookmarking the report, users ensure their selected indicators and filters are retained for subsequent visits to the Indicator Analysis page.
How to Use:
Create Custom Report:
-
Navigate to the "Indicator Analysis" page.
-
Click on the "Create Report" button.
-
Fill in details such as Report Name, Description, and Visibility.
-
Choose between "Private" or "Public" visibility options.
-
Select "Yes" to display for non-logged-in users or "No" to restrict access.
-
Click "Create" to add the new report.
Build Custom Report:
-
After creating the report, select it from the "Report List."
-
Add indicators by navigating to the "Indicators List" and clicking on desired indicators.
-
Click "Save" to add selected indicators to the report.
Bookmark Custom Report:
- Once the report is built, click on the bookmark button as shown in the screenshot below.
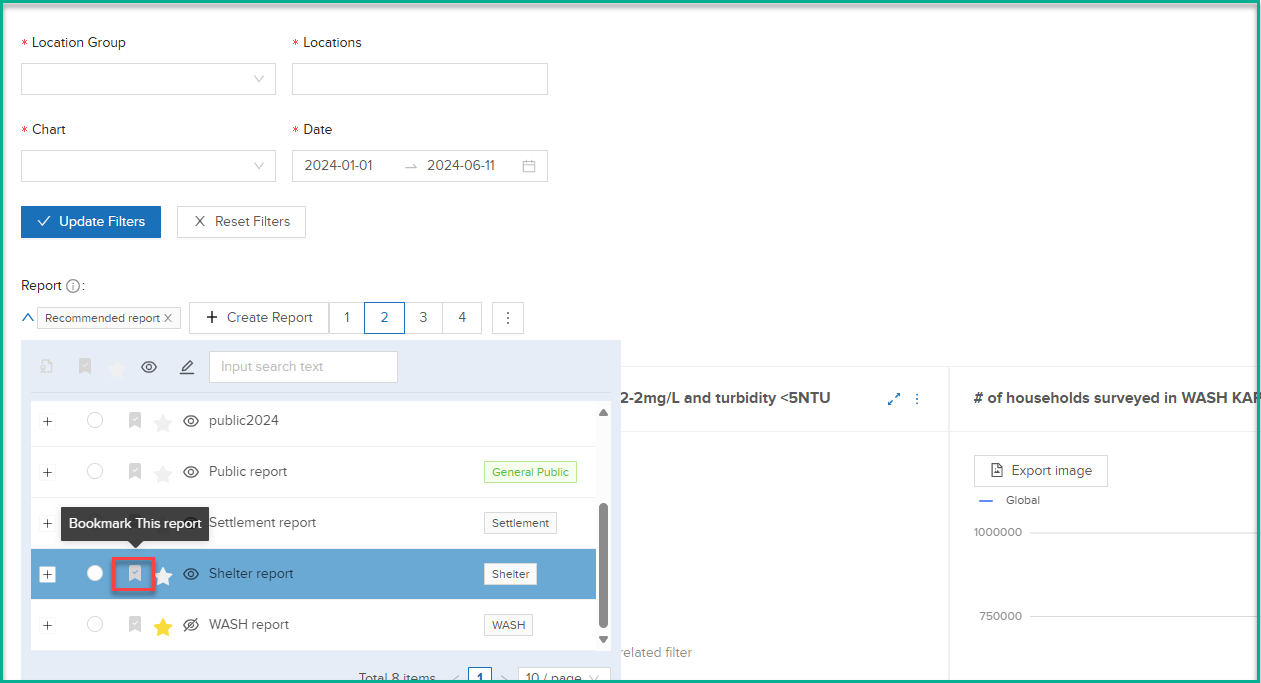
- This action saves the report with its selected indicators and filters.
Accessing Saved Report:
Upon revisiting the Indicator Analysis page, users will find their saved report with previously selected indicators and filters intact.