GIS Visualization
The GIS Visualization page is a powerful tool that enables users to explore and analyze geospatial data in a visual and interactive manner. It provides a comprehensive view of geographical information and offers a range of features to enhance data visualization and analysis.
The GIS map consists of multiple layers representing different types of geographic information. These layers include regions, countries, sites, boreholes, RTM devices, and health facilities. Each layer provides valuable insights for analysis and exploration.
Users can interact with the map to select or deselect specific layers, allowing them to focus on the desired information. The map also supports zooming and navigation functionalities, enabling users to explore specific areas of interest in more detail.
Accessing the GIS Map
What : Access The GIS Page .
Who : Non-logged user, Global Admin, Country Admin, Editor and Viewer .
How :
- Go to https://tims.unhcr.org/ in your web browser.
- If you are a registered user, sign in with your username and password as usual. For anonymous users, you can directly access the GIS Page without signing in.
-
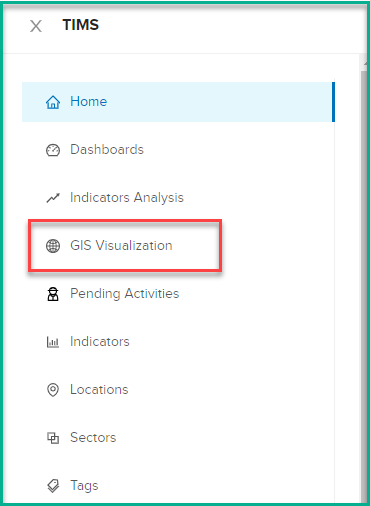
Open the GIS Visualization page
Layers and Legend
The GIS map consists of different layers that provide visual representations of various data. Understanding and effectively managing these layers is essential for a comprehensive map view. Here are the key aspects of working with layers on the map:
Understanding the location groups on the map
The GIS map consists of various layers that represent different types of information, enabling users to explore and analyze geographic data.
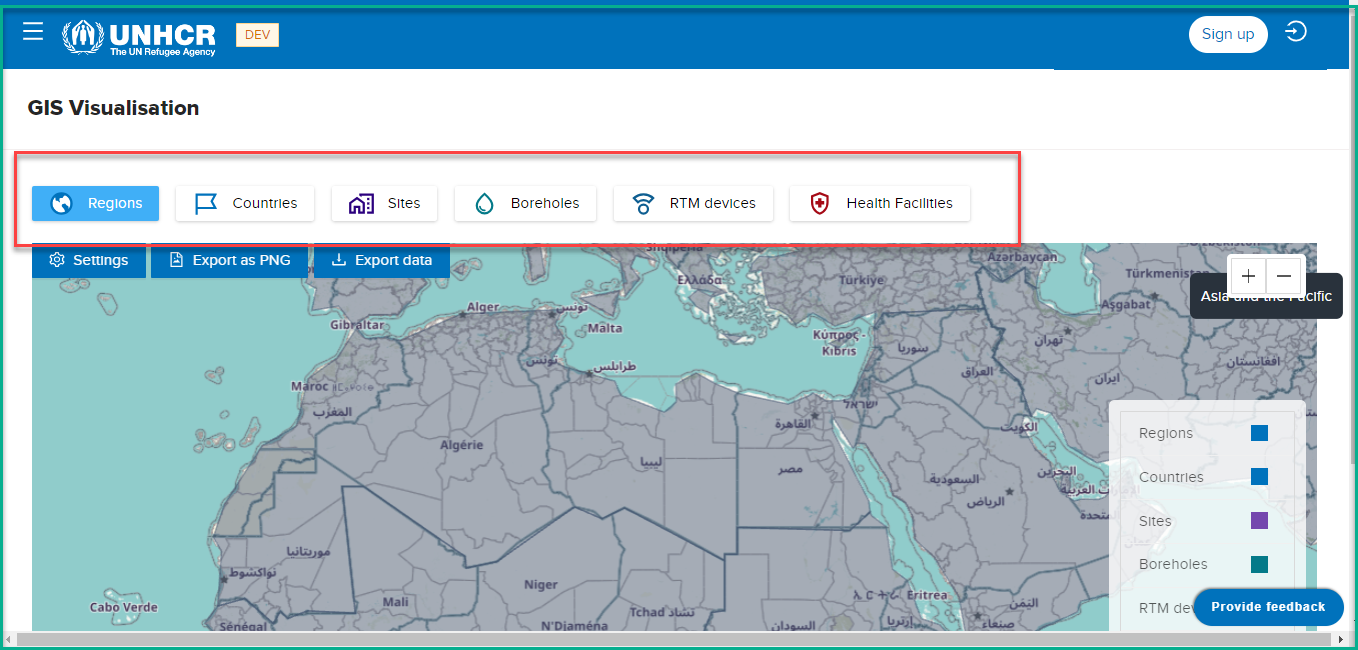
These location groups (layers) include
-
Regions : Representing larger geographic areas that encompass multiple countries and sites.
-
Countries : Denoting individual nations within a region.
-
Sites : Referring to specific locations within a country.
-
Boreholes : Signifying drilling points within a site.
-
RTM devices : Representing monitoring devices installed at specific locations.
-
Health Facilities : Depicting medical establishments situated at various locations.
Each layer corresponds to specific geographic data, offering valuable insights for analysis and exploration. By organizing information into these layers, users can easily access and analyze specific types of locations on the map.
Viewing and hiding specific location group (layer)
To view and hide specific layers on the GIS map, follow these steps:
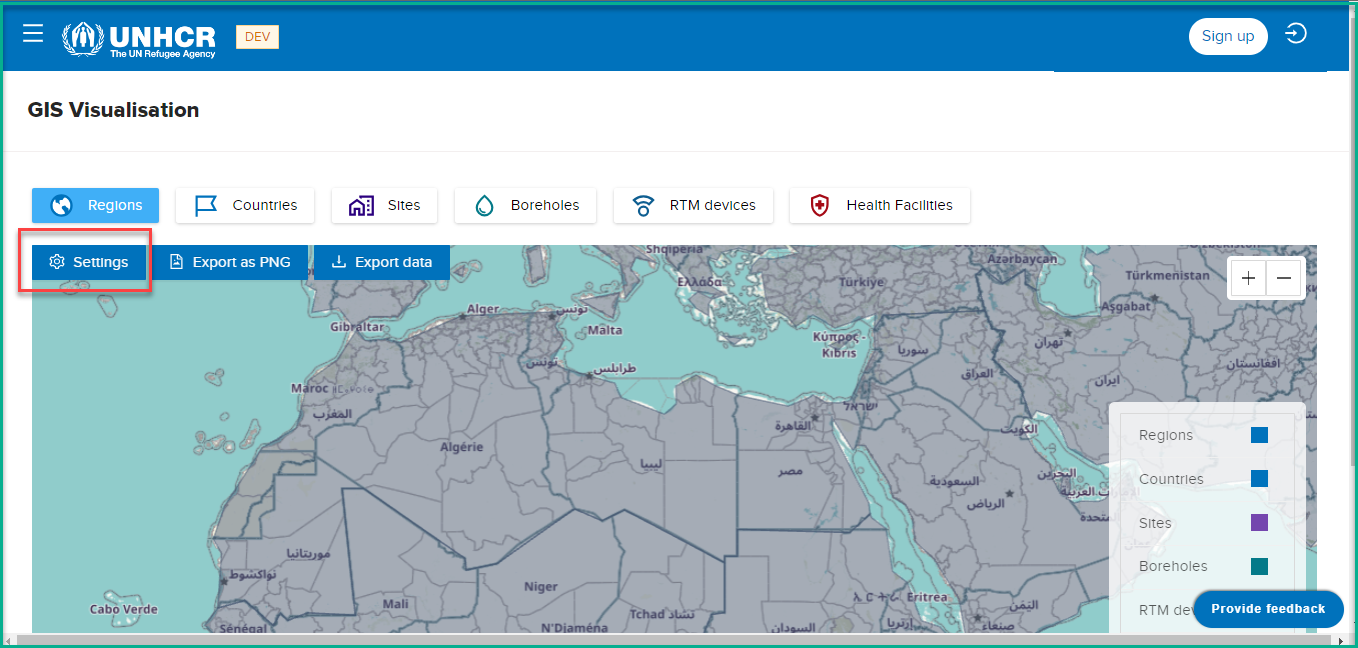
- Click on the "Settings" button. This button is typically located in the map interface.
- Once you click on the "Settings" button, the system will display the "Location Groups" section. This section includes various checkboxes and a color legend.
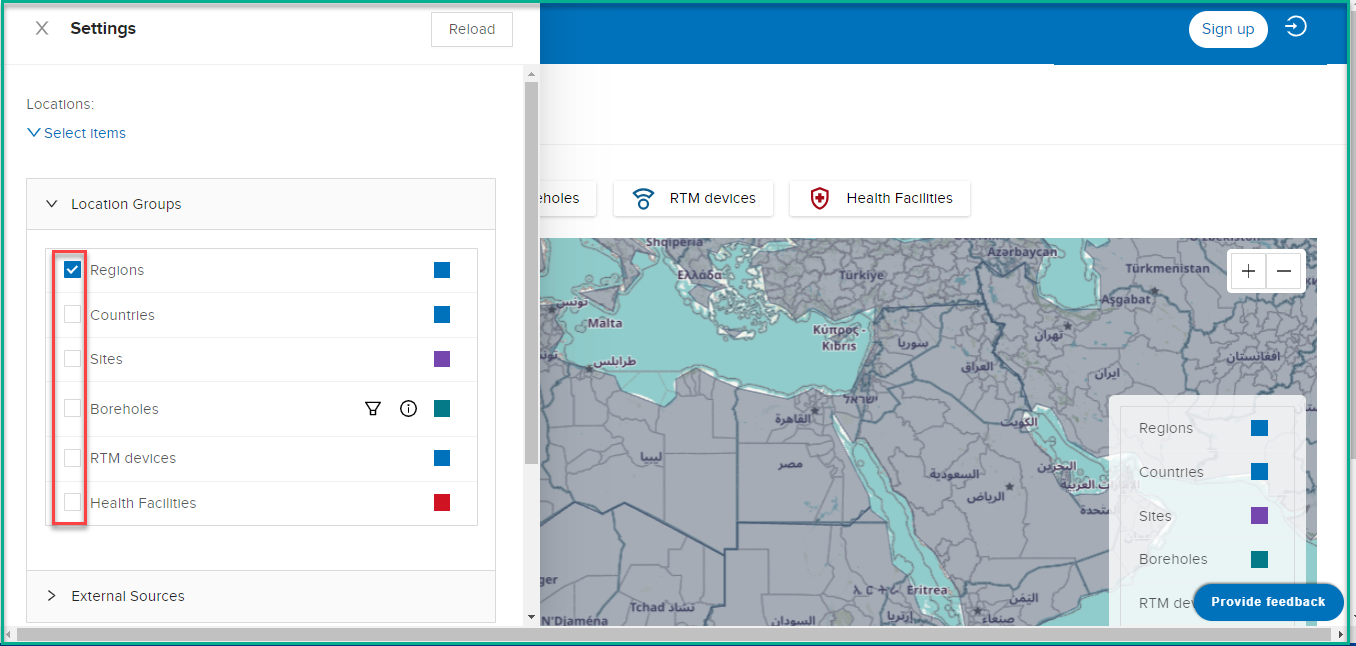
-
In the "Location Groups" section, you will find the following checkboxes corresponding to all different layers, To view a specific layer, check the corresponding checkbox. For example, if you want to view the "Sites" layer, check the "Sites" checkbox.
-
After checking a checkbox, the system will load and display all the locations belonging to that layer on the map. You will be able to see the relevant sites, boreholes, RTM devices, or health facilities, depending on the layer you selected.
-
To hide a specific layer, simply uncheck the corresponding checkbox. For example, if you want to hide the "Sites" layer, uncheck the "Sites" checkbox.
As you make changes by checking or unchecking the checkboxes, the map will dynamically update to reflect the displayed or hidden layers
Search Functionality
Searching for specific locations
If you want to focus on specific locations, you can choose the individual location selection option. This allows you to select and work with locations one at a time. You can search for a particular location, such as a country, site, or borehole, and the system will highlight it on the map for further analysis and exploration.
What : Individual Location Selection.
Who : Non-logged user, Global Admin, Country Admin, Editor and Viewer .
How :
- Go to https://tims.unhcr.org/ in your web browser.
- If you are a registered user, sign in with your username and password as usual. For anonymous users, you can directly access the GIS Page without signing in.
- Open the GIS Visualization page
- Click on Settings button
- Click on Locations list
- Use the search or filtering functionality to locate the desired location.
- Click on Locations list
The system will highlight the selected location on the map for further analysis and exploration.
Searching for specific location group
What : Select locations in groups.
Who : Non-logged user, Global Admin, Country Admin, Editor and Viewer .
How :
- Go to https://tims.unhcr.org/ in your web browser.
- If you are a registered user, sign in with your username and password as usual. For anonymous users, you can directly access the GIS Page without signing in.
- Open the GIS Visualization page
- Click on Settings button
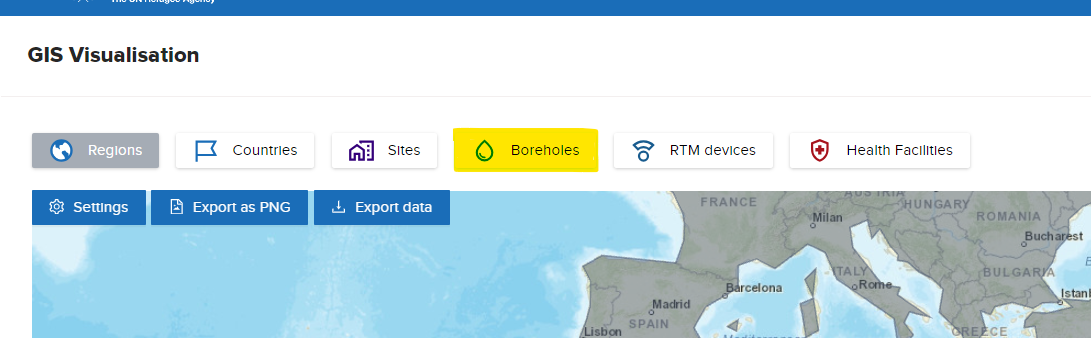
- Identify the specific location group you want to work with (e.g., "Boreholes").
- Check the checkbox associated with the location group.
The system will load all the locations belonging to that group onto the map.
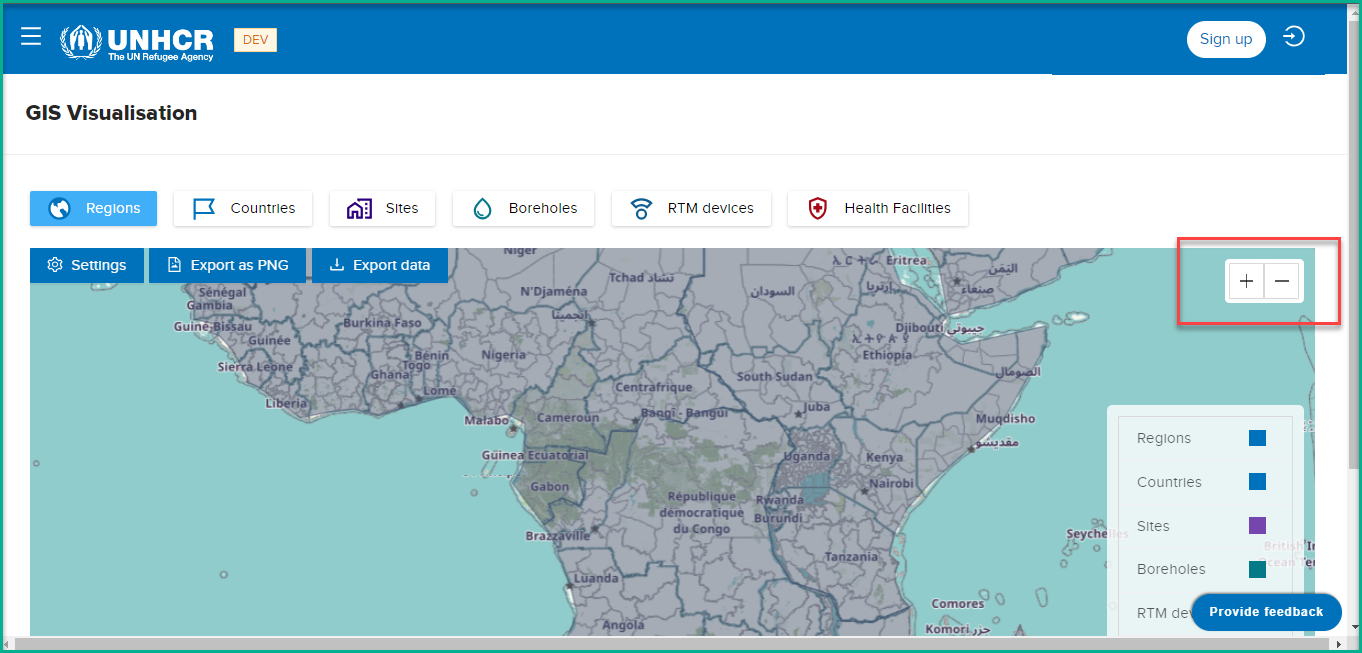
Map Navigation
Map navigation controls allow users to manipulate the map view and navigate through different areas. Here are the steps for zooming in and out and reloading the map:
Zooming in and out
What : Zooming in and out.
Who : Non-logged user, Global Admin, Country Admin, Editor and Viewer .
How : - To zoom in, locate the zoom controls on the map interface. These controls are represented by plus (+) and minus (-) symbols.
-
Click the zoom in control or button to magnify the map view. Each click will incrementally zoom in, bringing you closer to the map's details.
-
To zoom out, use the zoom out control or button. Clicking it will gradually decrease the map's scale, showing a broader view of the area.
-
Alternatively, you can use the scroll wheel on your mouse (if available) to zoom in and out. Scroll forward to zoom in and backward to zoom out.
-
Repeat the zoom in or zoom out actions as needed to adjust the map view to the desired level of detail.
Reloading the map
What : Reloading the map.
Who : Non-logged user, Global Admin, Country Admin, Editor and Viewer .
How :
To reload the map, follow these steps:
-
Click on the "Settings" button.
-
In the settings menu, click on "Reload" button.
-
Upon clicking, the system will prompt a message asking, "Are you sure you want to reload the page? This will clear the cache, and you'll have to reload the selected layers."
Read the message carefully. The system suggests clicking "Yes" only if you are experiencing performance issues and need to clear the cache. If you click "Yes," the map will reload with the default data.
Data Display and Visualization
What : Data Display and Visualization.
Who : Non-logged user, Global Admin, Country Admin, Editor and Viewer .
How :
The data display and visualization feature allows users to view useful information associated with selected locations on the GIS map. Here's how you can explore and visualize meaningful data for different location :
-
Start by selecting a location group of interest, such as "Sites," "Boreholes," "Country," or "Region." This can be done by checking the corresponding checkbox in the "Location Groups" section.
-
Once you select a location group, the system will load and display all the relevant locations belonging to that group on the map. For example, if you select the "Sites" location group, you will see all the sites marked on the map.
-
To explore specific details for a particular location, zoom in to the desired site on the map. As you zoom in, the map will display a list of selected locations, which may include the name of the site and other relevant data.
-
Click on the selected location in the list to expand it and access more detailed information. For example, you may find data fields such as Name, Code, Location Group, Parent, Status, Visibility, and additional informative details related to the location.
- Look for meaningful data fields specific to the selected location group. For instance, if you are reviewing borehole data, you might find information such as Depth, Water Level, Pumping Rate, or Water Quality parameters. Similarly, for country or region data, you may find details such as Name (French) , Area, ISO3 Code, or Status UN.
Analyze the displayed data to gain insights and make informed decisions based on the information available for the selected location.
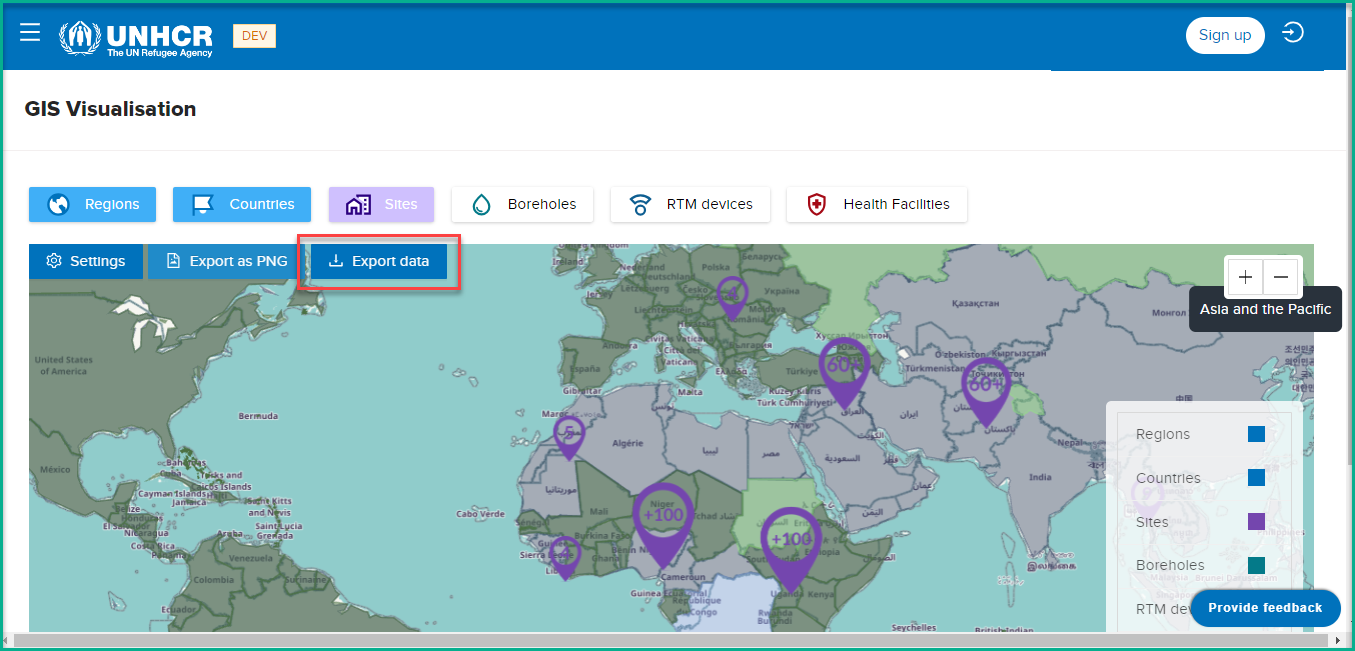
Exporting maps in various formats (JSON, image)
The GIS map offers the functionality to export maps in different formats, such as JSON and image files, allowing users to save and share the map visuals. Here are the export options available:
Export as JSON
What : Export Data as JSON.
Who : Non-logged user, Global Admin, Country Admin, Editor and Viewer .
How :
If you click on the "Export Data" button, the system will export the map data as a JSON file. This format preserves the geographic information, including the location coordinates and associated attributes. Exporting the map data as JSON enables you to use it for further analysis, integration with other systems, or data manipulation.
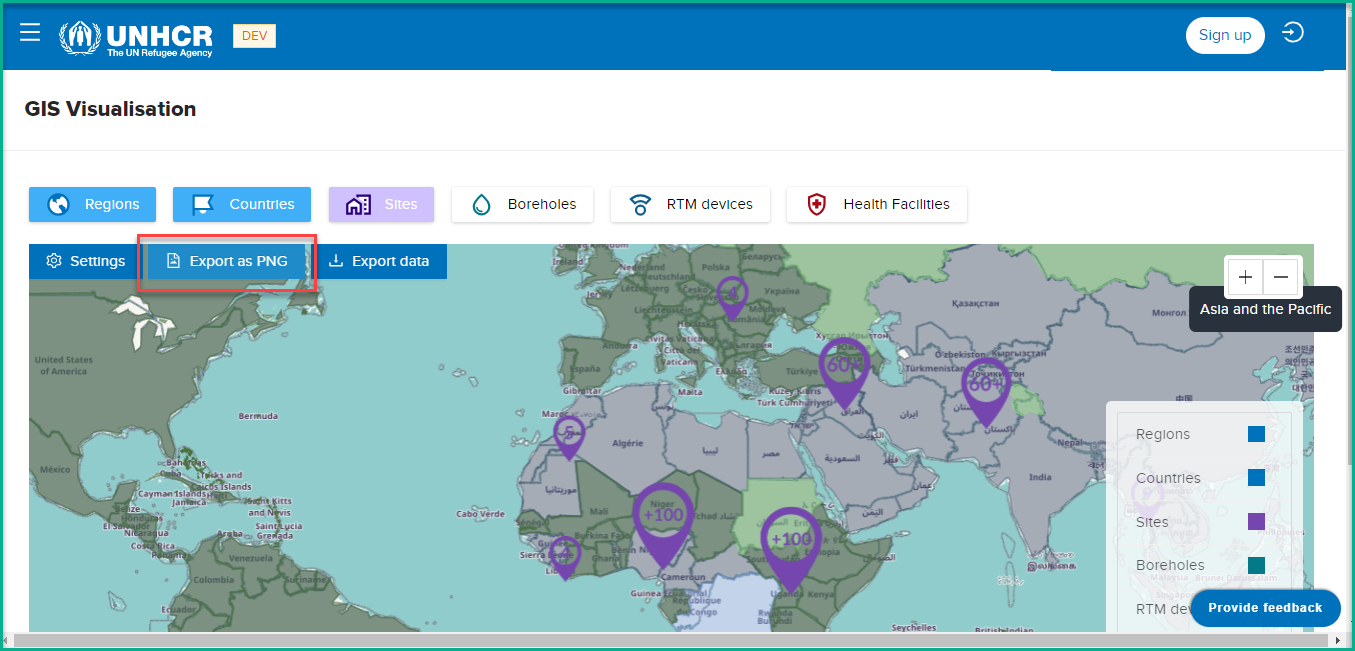
Export as PNG
What : Export as PNG.
Who : Non-logged user, Global Admin, Country Admin, Editor and Viewer .
How :
By clicking on the "Export as PNG" button, the system will export the map as an image in PNG format. This image file captures the current map view
External Resources
The GIS map provides access to external resources that offer additional geospatial data and information.
What : Explore External Resources.
Who : Non-logged user, Global Admin, Country Admin, Editor and Viewer .
How :
To explore these external resources, follow these steps:
-
Click on the "Settings" button within the GIS map interface. This will open the settings menu.
-
Within the settings menu, locate the "External Resources" section. Expand this section to reveal the available external resource options.
-
Among the external resource options, you will find "BRGM OneGeology" as one of the options. Click on expand icon next to "BRGM OneGeology" to reveal the sub-options.
-
Once expanded, you will see various sub-options under "BRGM OneGeology" that provide additional geological data and information.
-
To access the external source for a specific option, such as "Africa: 1:10M Geological units," click on check box. The system will load and display the external source on the map, using specific colors or symbols to represent different geological units or features.
If you want to understand the meaning of the colors or symbols used in the external source, click on the information (i) icon associated with that external source. This will provide you with a legend or explanation of the colors or symbols used
Boreholes
Borehole is one of the location groups available in our system. It represents drilling points within a site. Users with appropriate access rights, such as Global Admin and Country Admin, can perform various actions related to boreholes. Here is the process for updating a borehole:
Update Borehole
What : Update Borehole.
Who : Global Admin and Country Admin.
How :
- Click on borehole option .
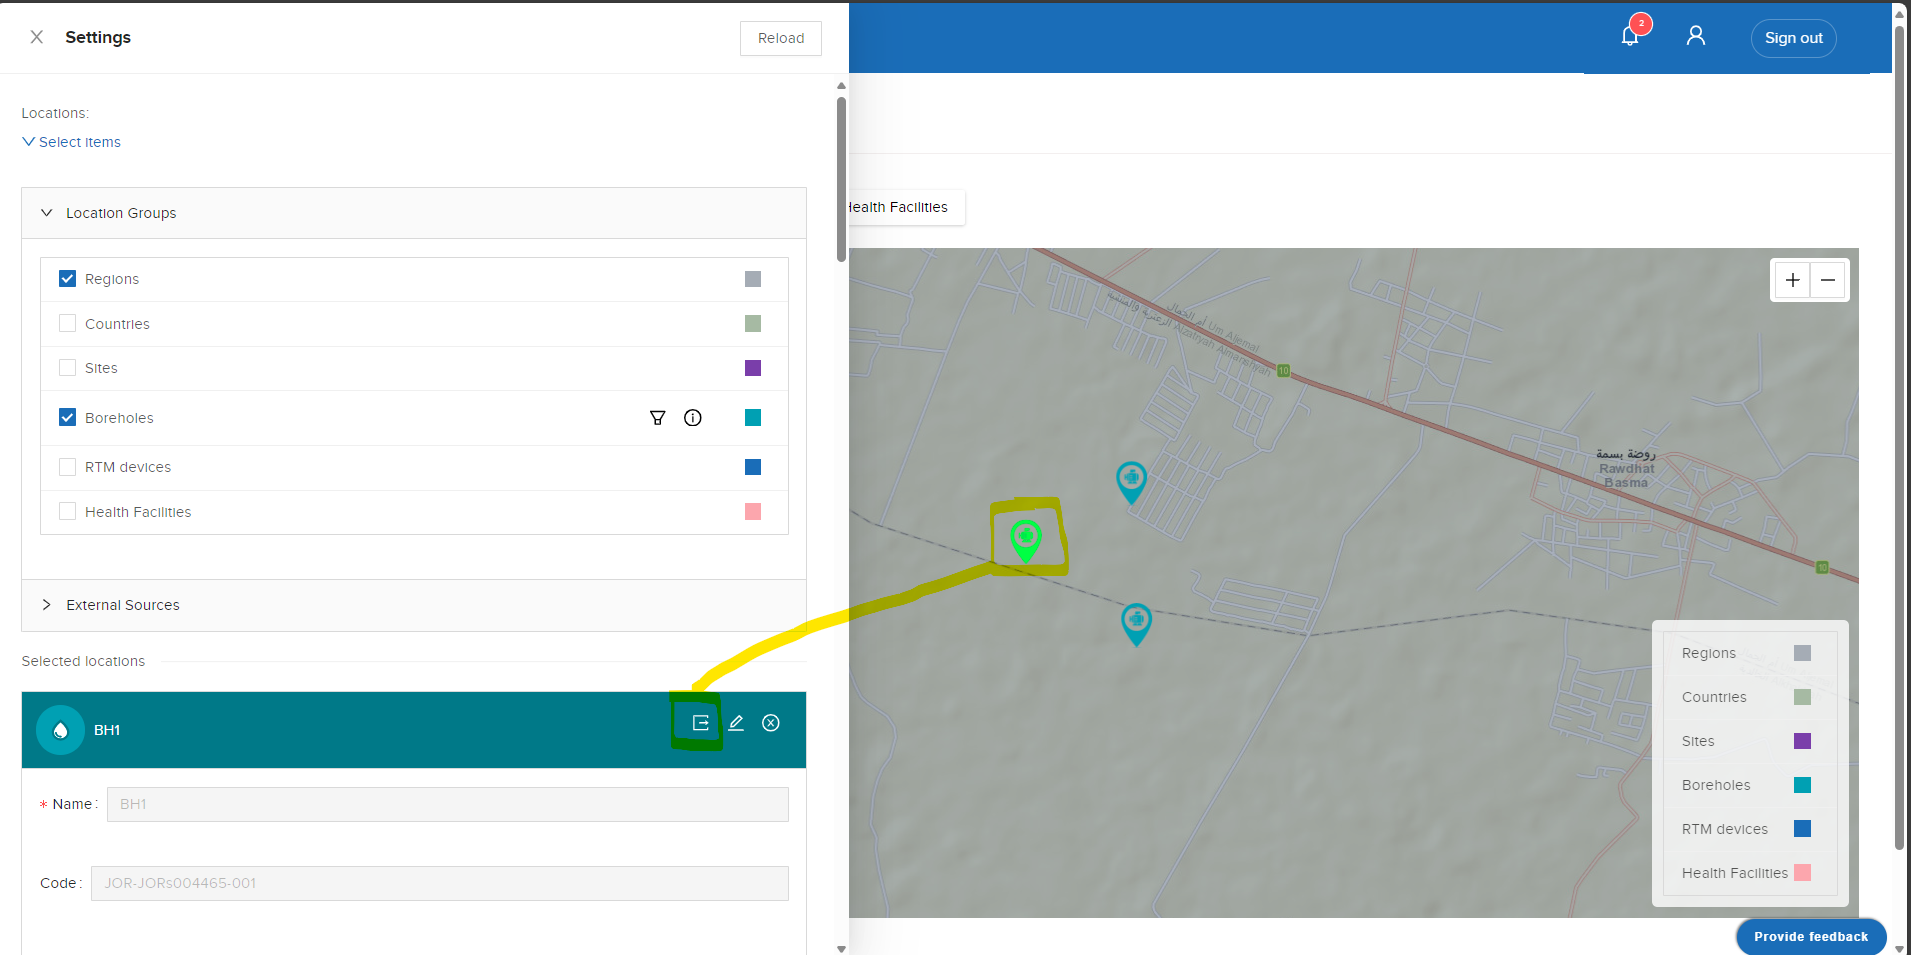
-
Select the borehole location on the map by clicking on it. This will add a new record to the Selected Locations list.
-
In the Selected Locations list, click on the "Edit" button next to the borehole record. This will open a new page for editing the borehole details.
-
On the edit page, make the desired changes to the borehole information. You can modify attributes such as the borehole's name, coordinates, depth, water level, and other relevant data.
-
After making the necessary changes, review the updated information to ensure accuracy.
-
Once you are satisfied with the modifications, click the "Submit" button to save the updated borehole data.
Note:
- Global Admins have the authority to update any borehole in the system, regardless of its location. However, Country Admins can only update boreholes that belong to their designated country or area of responsibility. This ensures that Country Admins can manage and maintain the borehole data within their jurisdiction.
Export Borehole Info
What : Export Borehole Info .
Who : Global Admin and Country Admin.
How :
- Click on borehole option .
-
Select the borehole location on the map by clicking on it. This will add a new record to the Selected Locations list.
-
In the Selected Locations list, click on the "Export" button next to the borehole record.
Make Borehole Inactive
-
Select the borehole location on the map by clicking on it. This will add a new record to the Selected Locations list.
-
In the Selected Locations list, click on the "Edit" button next to the borehole record. This will open a new page for editing the borehole details.
-
On the edit page, locate the option to change the borehole's status.
-
Select the "Inactive" status to mark the borehole as inactive.
-
Review the other details on the edit page to ensure they reflect the desired changes.
-
Click the "Submit" button or a similar option to save the changes and make the borehole inactive.
Filter
The borehole section also offers a specific filter option to facilitate data exploration and analysis.
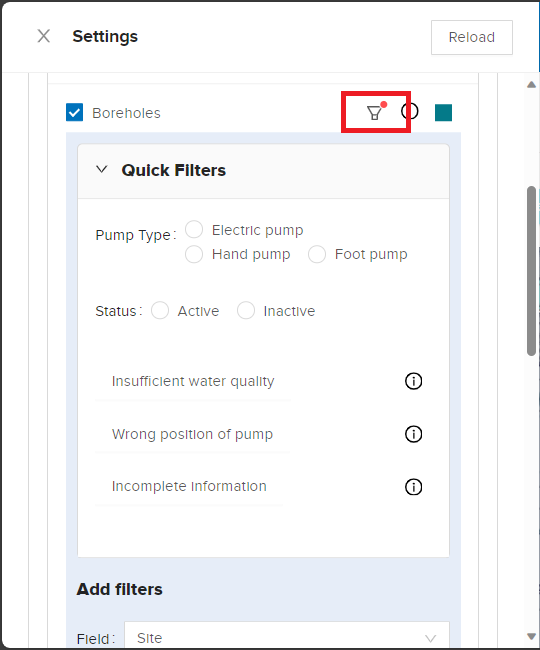
Users can apply filters to narrow down the displayed boreholes based on specific criteria. The available filters include:
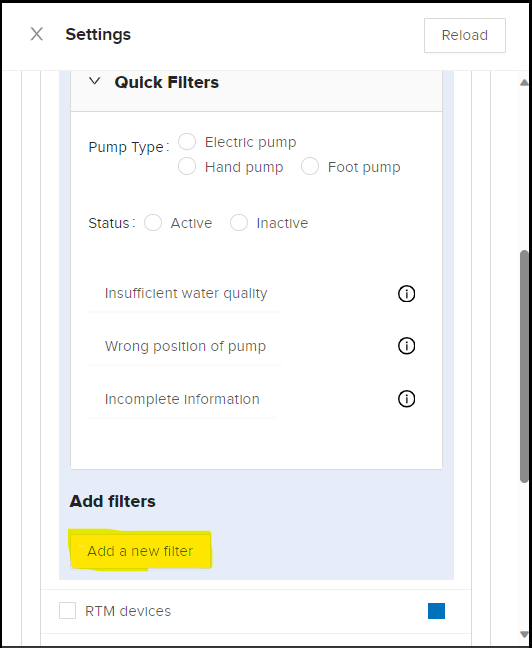
Pump Type: Users can filter boreholes based on the type of pump installed, such as Electric pump or Hand or foot pump. This filter allows for a targeted analysis of boreholes based on the pumping mechanism.
Status: Boreholes can be filtered based on their status, whether they are active or inactive. This filter enables users to focus on specific sets of boreholes based on their operational status.
Country: Users can apply a filter to display boreholes specific to a particular country. This filter allows for a country-specific analysis and exploration of boreholes within the selected country.
Advanced Filters:
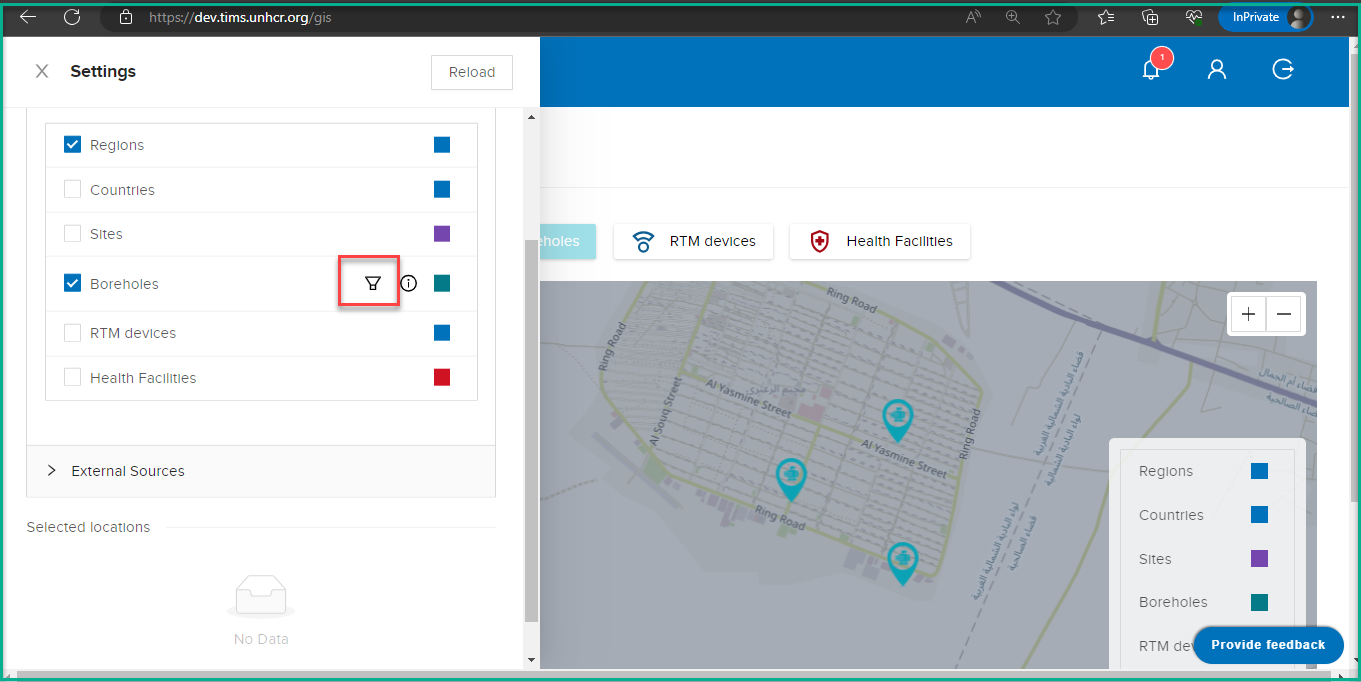
- Access the Advanced Filter :
In the GIS Visualization tool, locate the Borehole filter icon.
- Add a Filter Criteria:
Click on "Add Filter" to begin configuring your filter.
Choose a filter criteria from the available options. For example, you can filter by "Country," "Site," or "Has Attachment."
- Choose a Condition:
After selecting a filter criteria, a dropdown list of conditions will appear. Choose the condition that best suits your filtering needs. Conditions may include "Equal," "Not Equal," "Contains Data," or "Does Not Contain Data."
- Enter a Value:
Once you've chosen a filter criteria and condition, you'll need to enter a specific value that you want to filter by. For example, if you selected "Country" and "Equal," you would enter the name of the country you want to filter for.
- Apply the Filter:
After entering the value, apply the filter by clicking the "Apply Filter" button or a similar option. The system will process your filter criteria and display the filtered results.